Introduction
Why Reporting and Querying Confuse Teams
Dataverse supports multiple ways to retrieve and present data, each with different:
- Capabilities
- Limits
- Performance behaviors
- Security trimming outcomes
Most confusing comes from assuming:
- Search is reporting
- A view equals an API query
- Power BI numbers should match the UI instantly
In Dataverse, operational querying and enterprise analytics are related- but not the same problem.
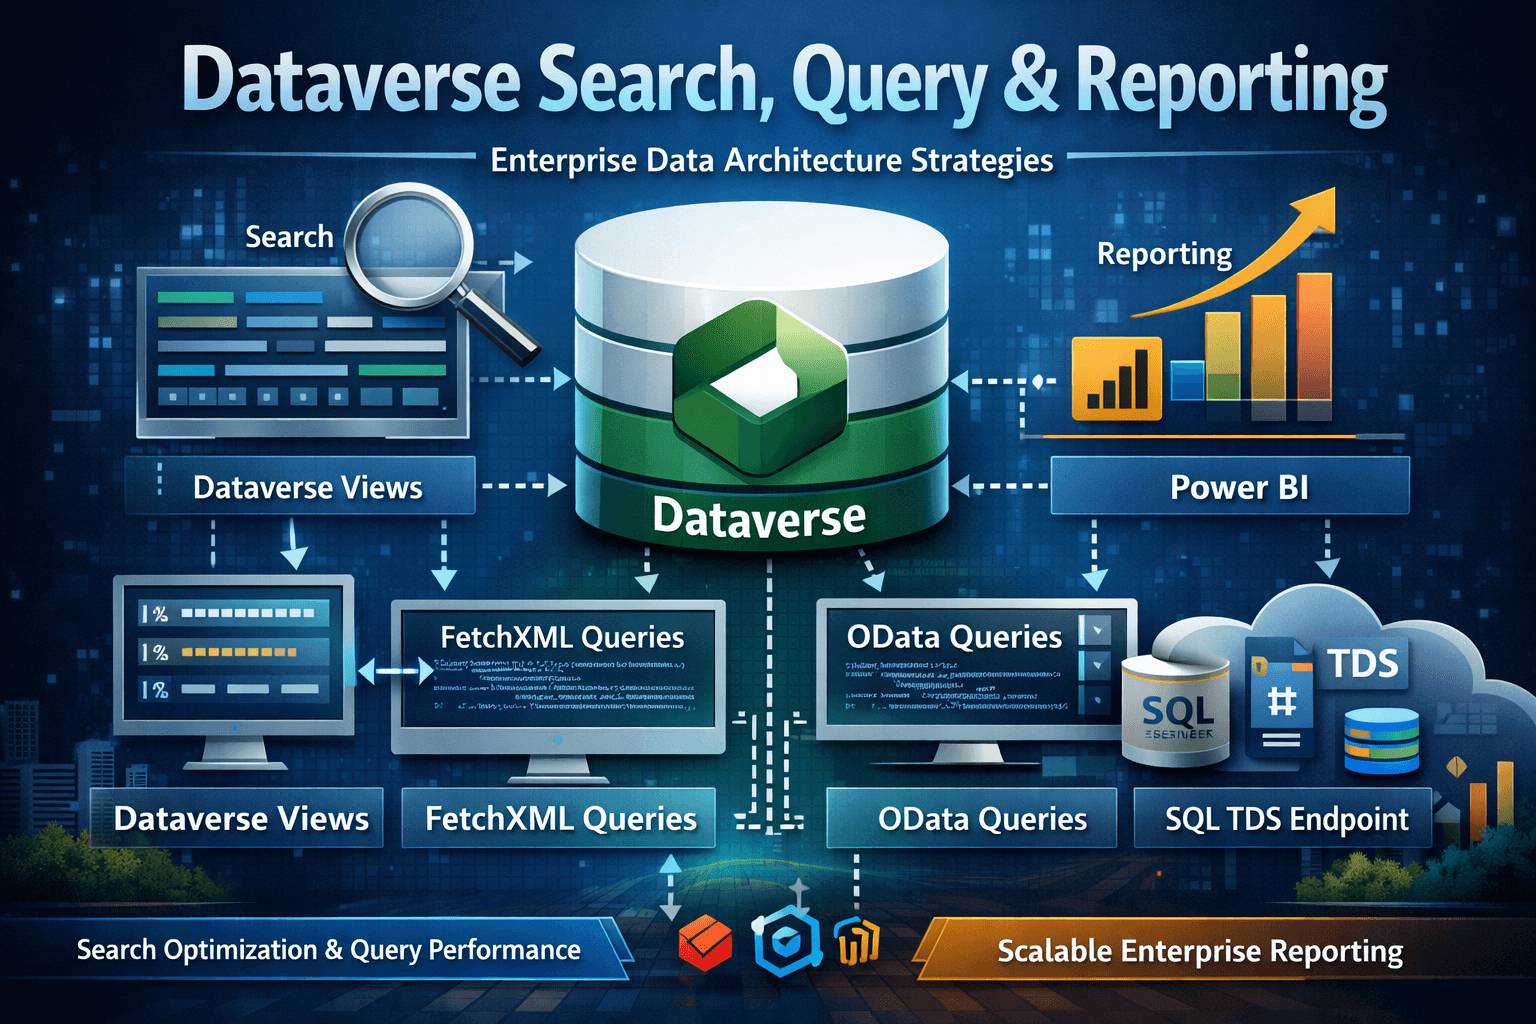
Query & Search Options
Views(System/Personal Views)
- Used by model-driven apps
- Metadata-defined filters and columns
- Security trimmed
- Optimized for operational use
FetchXML
- Query language used heavily in Dynamics features
- Supports aggregate and link-entities
- Works well for model driven needs
- Has constraints but very practical
OData (Dataverse Web API)
- REST standard query interface
- Best for external integrations and apps
- Supports $select, $filter, $expand, $sortby
- Performance depends heavily on query shape
Dataverse Search/Relevance Search
- Index backed
- Optimized for search experience
- Not guaranteed to behave like view or report.
Power BI/Fabric Analytics
- Seperate layer with refresh, latency, and semantic models
- Not designed to be "screen equals report" by default
High Level Querying Architecture Diagram
User/App/Report
    |
    |- Operational UI
    |       |- Views
    |       |- Quick find/Search
    |       |- FetchXml(behind the scenes)
    |
    |- Programmatic Access
    |       |- OData Web API
    |       |- SDK
    |
    |- Analytics Layer
            |- Power BI Semantic Model
            |- Fabric/Lakehouse
            |- Enetrprise Data Warehouse
FetchXML vs OData
Scenario A: Retrieve Accounts filtered by name and selected columns
OData Web API
GET /api/data/v9.2/accounts?$select=accountid,name&$filter=contains(name,'Contoso')&$top=10
FetchXML
<fetch top="1" >
  <entity name="account" >
    <attribute name="name" />
    <attribute name="accountnumber" />
    <attribute name="telephone1" />
    <attribute name="accountid" />
    <order attribute="name" descending="false" />
    <filter type="and" >
      <condition attribute="name" operator="like" value="%Contoso%" />
    </filter>
  </entity>
</fetch>
When to use
- OData
- Integrations
- REST clients
- FetchXML
- Model-driven features
- Complex joins/aggregations
- Platform-native querying
Scenario B: Join Account -> Contact and filter contacts
OData
GET GET /api/data/v9.2/accounts?$select=accountid,name&$expand=contact_customer_accounts($select=contactid,fullname)&$filter=contains(name,'Contoso')&$top=10
FetchXML (link-entity)
<fetch>
  <entity name="account" >
    <attribute name="name" />
    <attribute name="accountnumber" />
    <attribute name="telephone1" />
    <attribute name="accountid" />
    <order attribute="name" descending="false" />
    <link-entity name="contact" from="parentcustomerid" to="accountid" alias="ac">
      <attribute name="fullname" />
      <attribute name="emailaddress1" />
      <filter>
        <condition attribute="fullname" operator="like" value="%Annie%" />
      </filter>
    </link-entity>
  </entity>
</fetch>
Common confusion
- OData expands can become heavy and slow if overused
- FetchXML joins can be more predictable in Dynamics scenarios
Scenario C: Aggregate (Count contacts per Account)
Aggregation is limited to 50000 records
FetchXML
<fetch aggregate="true">
  <entity name="account">
    <attribute name="name" groupby="true" />
    <attribute name="accountnumber" groupby="true" />
    <attribute name="telephone1" groupby="true" />
    <attribute name="accountid" alias="accountidmax" aggregate="max" />
  </entity>
</fetch>
OData Aggregation done via $apply keyword
GET accounts?$apply=groupby((statuscode),aggregate($count as count))
Prefer: odata.include-annotations="OData.Community.Display.V1.FormattedValue"
Enterprise guidance For aggregates and grouping FetchXML is often the most stable option inside the platform. For external analytics, we should use Power BI/fabric and not force dataverse to be data warehouse.
Why "Numbers Don't Match" (Operational vs Analytical Reality)
Common mismatch drivers
- Security trimming: different identities see different slices
- Latency: search indexing and rollups are asynchronous
- Aggregation differences: UI views vs BI semantic models
- Data model differences: operational schema vs star schema
- Caching: both UI and BI layers cache differently
Architect rule UI is not analytics source of truth, BI models are not transactional source of truth.
Performance Tuning Checklist (Opertaional Queries)
Model-Driven App/View Performance
- Keep views narrow(avoid too many columns)
- Avoid expensive filters (complex OR chains)
- Limit realted entity columns
- Use appropriate quick find columns
FetchXML Performance
- Keep joins minimal
- Filter early (apply filters at the most selective level)
- Avoid deep link entity chains
- Prefer server-side filtering over client filtering
OData Performance
- Always use $select (never pull full entity)
- Avoid wide $expand for large related sets
- Use $top and paging properly
- Avoid "contains" on large datasets unless necessary
- Be careful with $orderby on non-index-friendly fields
Cross-Cutting performance
- Excessive record level sharing(security evaluation cost)
- Large numbers of calculated fields
- Heavy synchronous plugins affecting read/write operations
- Overuse of client-side data shaping
Reporting Architecture Patterns (Dataverse vs Power BI vs Fabric)
Pattern 1: Operational Reporting (Inside Dataverse)
Use for
- Agent dashboards
- Daily operatinal views
- Small-to-medium datasets
- Real-time reports
Tools
- Model-driven dashboards
- Views and charts
- Embedded lightweight reports
Trade-offs
- Limited analytics depth
- Not designed for complex historical trends at scale
Pattern 2: Power BI Semantic Model (Most Common Enterprise Pattern)
Use for
- Department reporting
- KPI dashboards
- Trend analysis
- Self-service analytics with guardrails
Approach
- Extract from Dataverse and model in Power BI
- Star schema and DAX measures
- RLS aligned to business needs, not always identical to Datverse security
Trade-offs
- Refresh latency exists
- Requires modeling discipline
Pattern 3: Fabric/Lakehouse/Warehouse (Enterprise Scale Pattern)
Use for
- Multi system analytics
- Large volumes
- Long term retention
- Advanced AI/ML and big data use cases
Approach
- Land Dataverse data in lake
- Combine with ERP,web,IOT,etc
- Create curated layers and semantic models
Trade-offs
- Require data engineering
- More governance needed
Anti-Patterns to Avoid
- Treating Dataverse as a data warehouse
- Building dashboards directly on transactional tables at scale
- Matching BI RLS 1:1 with Dataverse security without design
- Expecting search results to match aggregate reports exactly
- Running large analytical queries during business hours
Deep Diagram - Recommended Reporting Split
Dataverse( Operational Truth)
  |
  |- Views/Charts (Operational)
  |
  |- APIs (Transactional and Integration)
  |
  |- Export/Replication (Analytics Feed)
        |
     Power BI semantic Model (Department BI)
        |
     Fabric/Lakehouse (Enterprise Analytics and Multi source)
Don't let analytics workloads compete with opertational workloads
Decision Matrix
| Requirement | Recommended Surface | Avoid |
|---|---|---|
| UI list filtering | Views / FetchXML | Power BI |
| External app integration | OData | Views |
| Complex platform joins | FetchXML | Wide OData expands |
| Full-text user search | Dataverse Search | Reporting queries |
| Department analytics | Power BI | Views |
| Multi-system analytics | Fabric / Lakehouse | Dataverse direct queries |
Role- Based Perspective
Admin
- Enable/monitor search features
- Support view performance issues
- Manage BI workspace access and refresh governance
Architecht
- Define reporting tier strategy (operational vs department vs enterprise)
- Decide data movement approach
- Standardize KPIs and metric definitions
- Govern self-service BI without blocking it
Summary
- Use views/search for operational UI
- Use FetchXML for platform native complex quiries/aggregates
- Use OData for integration and REST access
- Use Power BI for departmental analytics
- Use Fabric for enetrprise-scale multi source analytics